
This was an $11.3 billion increase from the April total of $60.3 billion. Exports fell steeply, which caused this change. This was the largest monthly export decline since April 2020. Imports stayed relatively flat. The data brings up worries about inflation and growth soon. The economy struggles with a high dollar, less foreign demand along with the effects of trade policies.
The Export Crunch – Sectoral Breakdown
In May, export activity fell – it went down by $11.6 billion, or 4.0 %, to $279.0 billion. The drop largely came from goods exports, which decreased by $11.4 billion to $180.2 billion. Particular areas caused this fall.
Industrial Supplies in addition to Materials, saw a $10.0 billion decrease. This came from less nonmonetary gold, which went down by $5.5 billion. Natural gas exports fell by $1.1 billion. Finished metal shapes also dropped by $1.0 billion.
Capital Goods: Fell $1.9 billion, led by semiconductors (-$0.6 billion), civilian aircraft engines (-$0.5 billion), and telecommunications equipment (-$0.4 billion) 12.
Services: Dropped a modest but widespread $0.2 billion, led by travel and transport services 12.
The sole positive is consumer goods exports, which increased $1.5 billion, led by pharmaceutical shipments (+$1.1 billion)
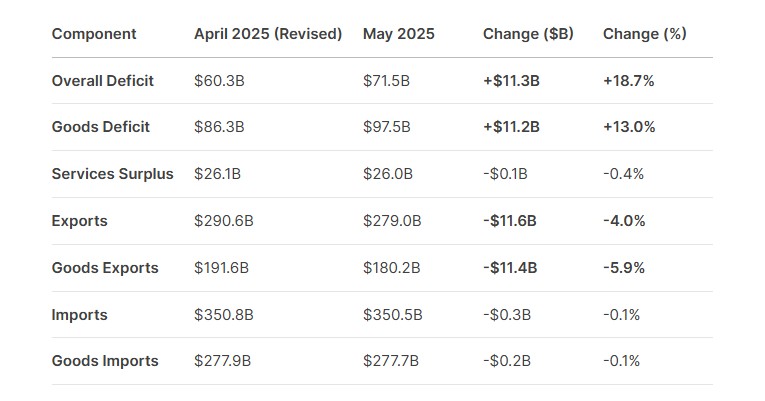
Imports stayed constant, even though the types of goods coming in changed.
Exports fell sharply. Imports dipped only $0.3 billion (0.1 %), to $350.5 billion. This small change hid big shifts within product groups.
Consumer goods fell $4.0 billion – this included textiles, apparel, along toys.
Industrial supplies decreased $0.9 billion, like finished metal shapes.
Autos and capital goods increased a lot. Automotive vehicle imports rose $3.4 billion, with passenger cars adding $3.1 billion to this number. Capital goods edged up $0.3 billion. A large $4.4 billion jump in computer imports drove this. That probably shows how businesses adjust to tariffs and new supply chains.
The next section will explain what caused the large drop in exports, plus the big increase in the trade deficit.
The growing deficit causes problems.
Trade contributes to second-quarter economic growth. The economy is likely to grow by 3.4 per cent. This comes from imports falling sharply from the first quarter’s increase. But exports are weak. New tariffs will lower long term U.S. economic output by 0.6 per cent, or $180 billion each year. High costs, problems in the supply chain, and less competition cause this.
Tariffs raise prices; they act like a tax that hurts poor households more. All tariffs from 2025 will raise consumer prices by 2.3 percent in the short term – this will cost households $3,800 a year on average because their money buys less. Clothing prices could jump 17 percent. New car prices could go up by $4,000.
Economists say that a long term difference between savings and investment in the country drives the U.S. trade deficit. The current account deficit, mostly from trade, must equal this savings investment difference. That is an accounting rule. Tariffs alone cannot reduce the overall deficit for long. Policies must increase national savings or decrease the demand for investment compared to savings. Tariffs just change where the deficit comes from. After 2018, the deficit shifted from China to Vietnam and other countries.